Hurun Chinese Luxury Consumer Survey 2026
The Hurun Research Institute today released the Hurun Chinese Luxury Consumer Survey & Hurun Best of the Best Awards 2026. This is the 22nd consecutive year Hurun Research has revealed the brand preferences, investment and lifestyle trends of China’s wealthiest individuals. Widely regarded as an ISO9000 for China’s luxury sector, the CLCS has become a benchmark for the luxury sector.
The Hurun Research Institute releases the
Hurun Chinese Luxury Consumer Survey & Hurun Best of the Best Awards 2026
(30 January 2026, Shanghai) The Hurun Research Institute today released the Hurun Chinese Luxury Consumer Survey & Hurun Best of the Best Awards 2026. This is the 22nd consecutive year Hurun Research has revealed the brand preferences, investment and lifestyle trends of China’s wealthiest individuals. Widely regarded as an ISO9000 for China’s luxury sector, the CLCS has become a benchmark for the luxury sector.
470 respondents completed the survey: including 70 ultra-high-net-worth individuals with assets exceeding CNY100mn (equivalent to US$14mn). Respondents have an average family asset value of CNY61mn (US$8.7mn), 38% higher than the five-year average, and average investable assets of CNY23mn (US$3.3mn). Wealth sources include investments (28%), salaries (22%), business dividends (21%), inheritance (16%), and rental income (13%). 78% of respondents are from first-tier cities (Beijing, Shanghai, Guangzhou, Shenzhen); the average age is 36, with U25s (25 and under) at 8%, U30s (26-30) at 19%, U35s (31-35) at 24%, U40s (36-40) at 19%, U45s (41-45) at 18%, and over 45 at 12%; 47% are male and 53% are female; 41% are married with children, mostly with one child.
Key findings from this year's report include: HNWIs have an average living area of 205 square meters, with 4.1 people living at home; they sleep 6.7 hours per day and exercise over 2 hours per week, with hiking/running being the preferred exercise. They spend 6.3 days per month with family, preferring Cantonese cuisine for family meals and Japanese cuisine for friends' gatherings. For relaxation, they favor hot springs/SPA/foot therapy, exercise, and enjoying solitude through reading and meditation. They drink one cup of coffee daily, preferring black tea in the morning, green tea and rock tea in the afternoon, and Pu-erh and white tea in the evening. They have 21 days holiday per year, with 5 international trips annually (2.1 for tourism, 2.9 for business). They work 45 hours per week and travel for business 6.9 days per month. Hong Kong is the top preferred overseas city, followed by Singapore. The average planned age for children's overseas education is 16. The song that has most touched them recently is Faye Wong's ‘The World Gave Me’. They aim to achieve financial freedom by age 47. For the coming year, they plan to reduce material consumption by 10% while increasing experience spending by 12%. 75% are looking to spend more on education/further study for themselves, with U35s focusing on MBAs and U40s on online learning platforms. For investments, gold is the top choice, followed by overseas investments (US and Hong Kong stocks), funds, and insurance. Overseas assets account for 15% of investable assets on average.
Chairman and Chief Researcher of Hurun, Rupert Hoogewerf, said:
“Very proud to be celebrating the 22nd year of the Hurun Best of the Best. Over this period, we have surveyed 11,000 China millionaires, making Hurun unquestionably the world’s largest researcher of China's luxury consumers. I hope this report continues to provide valuable insights to those with products or services targeting the Chinese high net worth individuals.”
“The size of the market is large. China today has just over two million households with wealth of CNY10mn or more and 120,000 with CNY100mn, according to the Hurun China Wealth Report. One third are based in East China, centered around Shanghai.”
Key Findings. For the full report, please see the original one in Chinese language.
Personal Investment Trends: For the coming year, HNWIs are looking to invest more into gold, overseas equities, especially US and Hong Kong stocks, while reducing exposure to real estate, art, and collectibles, reflecting a trend toward risk avoidance and diversified opportunities. Additionally, interest in overseas education and relocation has declined. Notably, gold has ranked as the top investment preference for Chinese HNWIs for three consecutive years, with gold prices rising from over CNY600 to over CNY1,100 per gram during this period.
Stock Market Predictions: Last year, our HNWIs' prediction for the year-end Shanghai Composite Index was remarkably accurate, differing by only 4% from the actual closing level. In March 2025, we forecasted a year-end level of 3,810, and the actual closing was 3,968. Over the past decade, HNWIs' predictions have averaged a 12% deviation from actual levels, with 2017 and 2021 seeing minimal 1% deviations, while 2018 and 2023 had larger discrepancies as actual outcomes exceeded many expectations. Overall, HNWIs tend to be optimistic, predicting higher levels than actual in six out of ten years. This year, they predict the SSE Composite Index will reach 3,820 by year-end, with 13% forecasting it will exceed 4,500—let's see what how accurate they are this year!
Well-being and Lifestyle: For HNWIs, wealth accumulation is the primary way to enhance happiness, followed by socializing with friends and family, learning, and maintaining physical and mental health. In terms of relaxation, they prefer hot springs/SPA/foot therapy, exercise, and enjoying solitude through reading and meditation. Currently, HNWIs report the strongest sense of happiness in their family lives.
Work-Life Balance Shifts: The average weekly working hours for HNWIs have increased from 44 to 45 hours, while annual vacation days have decreased from 24 to 21 days. The focus of their lives is shifting toward ‘physical and mental balance’, with growing demand for experiential entertainment and deep relaxation. Travel enthusiasm has rebounded significantly, and they place greater emphasis on exercise and solitude during downtime, demonstrating a pursuit of ‘memorable experiences’ and ‘physical and mental restoration’ that has surpassed mere material enjoyment.
Favourite tea and cuisines: HNWIs drink one cup of coffee daily, preferring black tea in the morning, green tea and rock tea in the afternoon, and Pu-erh and white tea in the evening. For family meals, they favor Cantonese cuisine, while Japanese cuisine is the top choice for gatherings with friends.
Health as Top Priority: In the era of longevity, health has become the top investment priority for HNWIs. Spending on ‘health and wellness’ has surged to the second position among planned consumption categories. Health management has shifted from ‘treatment’ to ‘prevention + wellness’, with refined, scenario-based health needs emerging as new growth points, such as the significant rise in interest in traditional Chinese medicine therapies.
Clear trend of reduction in spending on luxury: Over half of HNWIs plan to reduce spending on luxury goods, with increased interest in ‘practical clothing’. Enthusiasm for purchasing watches has noticeably declined, and interest in second-hand luxury items has significantly fallen, reflecting a widespread trend toward more rational consumption.
Focus on experiences instead of hard luxury: Planned annual material consumption, such as watches, jewelry, and collectibles, is significantly decreasing, while spending on service experiences is growing strongly, creating a stark contrast. The top three categories for increased spending are travel, health, and children's education.
How to communicate with them: Xiaohongshu and Douyin have become the primary platforms for HNWIs to obtain information, while DeepSeek and DouBao are the most commonly used AI assistants, indicating that digital tools have deeply integrated into their lives and decision-making processes.
Going global at a family level: Overall interest in permanent residences abroad and passports has declined, with Singapore and Canada cooling off. 84% of HNWIs consider overseas investment, but the allocation ratio has slightly decreased, with Hong Kong remaining the top destination. For overseas education destinations, the US remains at the top for the third consecutive year, though enthusiasm has slightly decreased by 2 percentage points; the UK ranks second, with enthusiasm dropping by 13 percentage points.
Preferred International Cities: Their preferred city outside of Mainland China was Hong Kong by a significant margin, followed by Singapore and New York. Tokyo, Paris, Dubai, Berlin, Los Angeles, London and Sydney made up the Top 10.
Generational Differences: Significant generational differences are evident in consumption preferences, information sources, and investment decisions. U30s and U25s focus more on entertainment and self-indulgence in consumption, showing particular interest in enterprise study tours. U35s and U45s, who face the highest work intensity, are the main drivers of overseas investment and further education (such as MBAs and EMBAs), with consumption priorities shifting toward children's education and professional family services. Individuals over 45 form the backbone of health and wellness consumption and premium baijiu consumption, with more conservative investment styles and greater trust in traditional German car brands.
Different generations, different preferences: Different age groups show distinct preferences in consumption, sports (U25s favor gym workouts, U40s prefer golf), tea preferences (U30s favor Pu-erh, U35s prefer green tea, U40s favor rock tea), and information sources (younger generations prefer Xiaohongshu). Brands need to adopt more refined approaches to engage these diverse segments.
Who are your rolemodels? Parents were first, followed by Elon Musk, Jack Ma, Warren Buffett, Lei Jun, Duan Yongping, and Steve Jobs.
Number of Boyfriends and Girlfriends: The average number of romantic partners HNWIs had before marriage was 5, whilst for ultra-high-net-worth individuals the average was 6.
Favourite song: The song of the year for China’s HNWIs was Faye Wong's The World Gave Me, with other popular songs including Hill, As Wished and Red Sun.
Overall, they are happy: Their overall happiness index was 8.1 out of a maximum of 10. Satisfaction with family life is the highest. Satisfaction with work and inheritance decreased by 0.9 points, while satisfaction with further education and wealth decreased by 0.7 points. Compared to last year, the anxiety levels of respondents have not changed significantly, but they are slightly more concerned about children's education and parents’ health.
Ways to Enhance Happiness: They hope to achieve financial freedom by the age of 47, one year older than last year and three years older than ten years ago. The methods for enhancing happiness have changed significantly compared to last year, with ‘earning material wealth’ (52%) ranking first, followed by ‘social gatherings with friends and family’ (36%), and ‘learning (e.g., reading, acquiring new skills)’ (34%) in third place. Additionally, the enthusiasm for enhancing happiness through ‘physical and mental health (e.g., meditation, solitude, exercise)’ has increased significantly by 9 percentage points. This year, respondents consider the present moment as the happiest.
Economic Confidence Index: This year only 26% were ‘very confident’ in China's economy going forward over the next two to three years, while 59% are ‘moderately confident’. By age group, those under 40 (5.6 points) and those aged 45 and above (5.8 points out of a maximum of 10) have higher economic confidence indices than the overall level (5.4 points).
A US$223 billion market for luxury, albeit down US$6.1bn. Among these, high-end watches experienced a double-digit decline of 14%, while high-end jewelry declined by 8%. Additionally, high-end clothing, footwear, and bags declined by 4%, 4%, and 6%, respectively.
The consumption focus of HNWIs is shifting from material goods to service experiences and emotional value, with the popularity of high-end services (such as hotels and tourism) continuing to rise. High-end tourism has shown the most significant growth, with leisure travel increasing by 11% and business travel by 8%.
The size of premium consumer electronics (including smart home appliances) was US$15, a 5% increase from last year. Among these, the wearable device market grew by 22%. The market penetration of AR glasses, robot dogs, and balance bikes is increasing year by year.
The luxury car market is showing signs of weakness, with the market size for luxury cars, defined as cars worth more than CNY500,000, declining significantly from US$8.9 billion to US$8.1bn this year. Among these, the market for cars priced between CNY500,000 and CNY1mn declined by 14%.
The premium tobacco, alcohol, and tea market is valued at US$4.3bn, a 6% decrease from last year. Premium baijiu is generally under pressure, down 6%. The imported alcohol market continues to be sluggish, declining by 7% compared to last year.
Future Consumption Plans: The top three categories of consumption that HNWIs plan to increase in the next year are tourism, health and wellness, and children's education. There are differences by age group: those under 25 and 30 are most enthusiastic about increasing entertainment spending, those aged 35 are more inclined to increase self-education spending, those aged 40 and 45 are most inclined to increase spending on children's education and professional services for the family, and those aged 45 and above are more willing to increase spending on health and wellness.
Over half of HNWIs plan to reduce spending on traditional luxury in the next year. By age group, those under 25 plan to reduce spending on health and wellness, those aged 30 plan to reduce spending on home maintenance, and those aged 35, 40, and 45 plan to reduce entertainment spending.
Overall, they plan to spend 58% more than last year on travel, and 41% more on health and wellness spending. In contrast, they expect to spend 33% less on traditional luxury, 18% less on gifts and 13% less on collectibles.
Future Consumption Intentions: Material Consumption down by CNY242,000, whilst Service Experience Consumption is up CNY90,000.
In planning for the next year, the average annual material consumption of HNW families is expected to decrease by US$35,000, specifically spending on watches is expected to decrease by US$18,000, on collectibles US$12,000, and on jewelry US$8,000. Spending on alcohol, cars, clothing, and luxury goods is expected to remain largely unchanged, while average spending on home maintenance is expected to increase by US$6,000.
For service experience consumption in the next year, HNWIs generally plan to increase spending. Average spending on health and wellness and on entertainment and tourism is expected to increase by US$7,000, US$7,000 and US$6,000 respectively. This indicates that HNW families are placing increasing importance on physical health as well as mental relaxation and enjoyment. In response to the asset planning needs of HNWIs, a new category, ‘professional services’ for the family (lawyers, tax advisors, family offices, etc.), has been added this year, with an expected average spending of US$25,000.
Clothing Preferences: Declining Enthusiasm for High-Luxury Brands, Rising Interest in Practical Apparel: Over the next year, among the types of clothing high-net-worth individuals are most willing to purchase, enthusiasm for high-luxury brands has dropped significantly by 12 percentage points, while interest in practical apparel (focused on comfort, indifferent to brand) has risen notably by 14 percentage points. Enthusiasm for custom-made clothing remains unchanged from last year, and interest in streetwear brands has declined slightly by 5 percentage points.
The secondhand luxury market has clearly receded. 41% of high-net-worth individuals are willing to purchase secondhand luxury items, a proportion that has decreased significantly by 24 percentage points compared to last year. Among those willing to buy secondhand luxury, handbags and accessories are the top choice, followed by jewelry.
Enthusiasm for high-end watches among high-net-worth individuals has clearly declined. The number of watches planned for purchase over the next year has dropped from 2.8 pieces per person last year to 1 piece this year, with 59% of respondents indicating they do not plan to purchase any watch over the next year.
Gift Preferences: Overall, the enthusiasm for gift-giving has decreased by 7% compared to five years ago: For men's gifts, the most preferred choice is electronics (15%), followed by premium tea or tea sets (11%). The preference for electronics has increased by 3 percentage points compared to last year. Last year's top choices, watches and premium baijiu have dropped four and one places, respectively, with shares of 10% and 11%. A new option, ‘health supplements’ (e.g., herbs, ingredients, nutritional supplements), has gained 7% enthusiasm, ranking seventh. Over the past decade, watches have been the top choice for men's gifts, except during 2019-2021, and electronics have been the top choice in the past five years.
For women's gifts, cosmetics (20%) are the most preferred, followed by jewelry (18%). The enthusiasm for jewelry remains largely unchanged from last year, while for cosmetics, it has increased by 5 percentage points. Accessories (14%) and fragrances (12%) rank third and fourth, with enthusiasm increasing slightly. Health supplements rank sixth with 6% enthusiasm.
Preferred Alcoholic Beverages: The enthusiasm for alcoholic beverages among HNWIs has decreased, with 18% of respondents not drinking alcohol. Among the various alcoholic beverages, baijiu (19%) remains the top choice, with 65% of baijiu enthusiasts preferring jiangxiang baijiu. Whisky (16%) and wine (16%) rank second, with decreases of 1 and 4 percentage points, respectively, compared to last year. Champagne (12%) ranks fourth, followed by craft beer (7%) in fifth place. Cocktails (4%) have experienced the largest decline, decreasing by 5 percentage points, ranking seventh.
Notably, those aged 35 show higher enthusiasm for whisky compared to other age groups, while those aged 45 are the main consumers of liquor. Among respondents aged 45 and above, 60% prefer wine, and this age group also shows higher enthusiasm for cognac compared to other age groups.
Tea Drinking Habits: Analyzing the tea drinking habits of HNWIs across three time periods—morning, afternoon, and evening—reveals a clear temporal pattern. In the morning (8-12 AM), black tea is the most preferred; in the afternoon (1-4 PM), green tea is favored; and in the evening (5-8 PM), Pu-erh tea becomes the top choice. Additionally, ultra-high-net-worth individuals show a particular preference for Pu-erh and black tea.
By age group, those under 30 prefer Pu-erh tea, those aged 35 prefer green tea, those aged 40 prefer rock tea (Da Hong Pao and Rougui), and those aged 45 and above prefer black and green tea.
Travel Preferences: The primary mode of travel for surveyed HNWIs is self-driving (58%), an increase of 5 percentage points from last year. The proportion of travel with a dedicated driver has decreased significantly by 17 percentage points to 26%, but over half of ultra-high-net-worth respondents still travel with a dedicated driver. The use of ride-hailing services has increased by 14 percentage points.
Car Purchase Preferences: 23% of surveyed HNWIs are not considering purchasing a car in the next two years, a significant increase of 16 percentage points from last year. Among those considering purchasing a car, SUVs are the most preferred (41%). Enthusiasm for sports cars and sedans has decreased by 6 and 14 percentage points, respectively, while 27% of ultra-high-net-worth respondents list sports cars as their top choice.
By age group, those aged 30 mostly consider purchasing sedans; those aged 35 consider purchasing sports cars; 40% of those aged 45 plan to purchase SUVs, a higher proportion than other age groups; and those aged 45 and above show the highest enthusiasm for purchasing MPVs.
In terms of brands, enthusiasm for traditional luxury brands BBA (Mercedes-Benz, BMW, Audi) has decreased, and there has been no significant increase in enthusiasm for other international brands (Tesla, Cadillac, etc.). Among Chinese electric vehicle new force brands, Huawei-affiliated brands (Wenjie, Zhijie, Xiangjie, Zunjie, etc.) are more favored, while enthusiasm for other domestic brands (NIO, XPeng, Li Auto, BYD, Hongqi, Great Wall, etc.) is lower.
Real Estate and Home Services: They own an average of 3.5 properties, living in a flat of 205 square meters with 4.1 people in the household. Second homes are mostly a local vacation home (23%), and overseas property ownership has increased significantly, with 15% of HNWIs owning a second home abroad, up 13 percentage points from last year.
In terms of home services, 88% of HNWIs frequently use home services, a decrease of 10 percentage points from last year. Cleaning (33%) remains the most frequently used home service, followed by nanny/caregiver (26%) and driver (13%). 96% of ultra-high-net-worth respondents frequently use home services, with a higher proportion of employing drivers, private chefs, and butlers compared to the overall respondents.
Family Advisors: In terms of commonly used family advisors, personal trainers (22%) remain the top choice, followed by wealth managers (11%) and lawyers (11%). Compared to last year, the ranking of wealth managers remains unchanged, while lawyers have moved up three positions. Family doctors and nutritionists have dropped two and four positions, respectively. This year, there is an increased demand for asset planning and risk management among HNWIs.
Satisfaction with the ‘Five Pillars of Longevity’: The Five Pillars of Longevity mentioned in the 2025 global bestseller Beyond 100 are exercise, nutrition, sleep, emotions, and preventive medicine. The overall satisfaction of HNWIs with these five aspects is 7.8 points out of a maximum of 10. Among these, satisfaction with nutrition is the highest at 7.9 points, followed by exercise, preventive medicine, and emotions, all at 7.6 points. Satisfaction with sleep ranks last at 7.4 points. The richer they are, the more satisfied they are.
In terms of exercise, 81% of surveyed HNWIs have a weekly exercise plan, 57% plan to exercise for more than 2 hours per week, and 7% are accustomed to walking 10,000 steps daily. Regarding nutrition, 43% of respondents adhere to a healthy diet (eating less, eating well); 20% focus on controlling alcohol intake, with ultra-high-net-worth respondents showing significantly higher concern for this aspect; and 23% pay attention to both healthy eating and moderate drinking. In terms of sleep, 69% of respondents sleep 6-8 hours per day, with an average of 6.7 hours, while ultra-high-net-worth respondents sleep slightly less, with an average of 6.5 hours.
In preventive medicine, 68% of respondents undergo regular in-depth health check-ups; 32% use electronic devices (such as wearables) to monitor health data; and 31% regularly visit anti-aging centers and wellness institutions for specialized treatments, primarily those aged 35-45. 25% of respondents use health apps for health management; 11% use home testing and therapy devices; and 23% have personal doctors for medical services. The proportion of ultra-high-net-worth respondents with personal doctors (35%) is significantly higher than the overall respondents.
Health Management Venues: This year, the most preferred health management venue is renowned public hospitals, with enthusiasm increasing significantly by 19 percentage points. Private hospitals rank second, with a share of 30%, an increase of 15 percentage points from last year. Enthusiasm for dental and ophthalmic institutions and health check-up centers has decreased significantly, with the largest declines seen in ophthalmic and health check-up institutions. The enthusiasm for maternity centers and women's and children's hospitals remains consistent with last year. Wellness institutions, as a new option this year, have gained 6% enthusiasm, matching the level of health check-up institutions. This indicates that wellness and healing have become a part of the daily health choices for many HNWIs.
Health Management Programs: In terms of personal care and wellness programs they plan to try in the next year, skincare management (19%) is the top choice, followed by traditional Chinese medicine therapy (16%) and light medical aesthetics (15%). Although skincare management and light medical aesthetics rank in the top three, their enthusiasm has decreased by 12 and 8 percentage points, respectively, compared to last year. In contrast, enthusiasm for traditional Chinese medicine therapy has increased significantly by 8 percentage points. The enthusiasm for dental aesthetics has dropped to 11%, a significant decrease of 12 percentage points from last year. Among the new options, high-end SPA massage has gained 10% enthusiasm, ranking fifth, while enthusiasm for longevity/anti-aging "black technology" (such as hyperbaric oxygen chambers, cryotherapy, and red light therapy) stands at 7%, ranking sixth.
By age group, 55% of those under 30 plan to try skincare management in the next year, 33% of those aged 35 plan to try high-end SPA massage, and 56% of respondents aged 45 and above plan to try traditional Chinese medicine therapy.
Sports Preferences: Overall Favor Hiking/Trail Walking and Running; U25 Enjoys Gym Workouts, U40 Enjoys Golf: Hiking/Trail Walking and Running have become the most favored sports among high-net-worth individuals this year, with enthusiasm levels of 16% and 15% respectively, with running's enthusiasm increasing by 3 percentage points. Yoga and Gym Equipment Training rank third and fourth, with enthusiasm levels increasing by 3 percentage points each compared to last year. Golf enthusiasm stands at 7%, decreasing by 2 percentage points; Tennis enthusiasm is also 7%, increasing by 2 percentage points. Badminton enthusiasm has decreased by 4 percentage points to 4%.
When broken down by age groups, there are significant differences in the top 5 preferred sports among different age groups. U25 shows higher enthusiasm for Gym Equipment Training compared to other age groups and is also the most enthusiastic about skiing. U35 most favors Yoga, and also shows enthusiasm for water sports and Tennis. U40 is the main demographic for Golf and horse riding. U45 most favors Yoga, followed by water sports. Among respondents over 45 years old, the proportion who enjoy cycling exceeds that of other age groups.
Among water sports, high-net-worth individuals most favor swimming (41%), with enthusiasm increasing by 15 percentage points compared to last year; followed by snorkeling (12%) and surfing (12%). However, enthusiasm for surfing and sailing has decreased significantly compared to last year.
The most frequented sports venue for high-net-worth individuals is outdoor spaces, with enthusiasm increasing by 6 percentage points compared to last year. Second is gyms, with an enthusiasm level of 22%, decreasing by 4 percentage points. Professional training venues (12%) and fitness studios (10%) rank third and fourth, with enthusiasm levels slightly decreasing compared to last year. The venue with the largest decline is clubs, with enthusiasm at 9%, decreasing by 9 percentage points. With the resurgence of high-end tourism, the new option "hotel/resort fitness centers" has gained 10% enthusiasm. Additionally, home-based exercise (such as private trainers coming to homes, home gyms, etc.) has also become relatively popular this year, with enthusiasm increasing by 5 percentage points.
Entertainment Preferences: Emphasis on Gaining Unforgettable Experiences: This year, the most favored entertainment is travel (32%), with enthusiasm increasing significantly by 11 percentage points, indicating a gradual revival of enthusiasm for high-end travel. The second most favored entertainment method is culinary experiences (21%), with enthusiasm increasing by 5 percentage points compared to last year. Family activities (11%) and parties/dinners (8%) rank third and fourth. Additionally, enthusiasm for entertainment methods such as wine tasting, camping, and themed exhibitions has slightly decreased compared to last year. From this, it can be seen that this year, high-net-worth individuals place more emphasis on experiences and emotional connections when choosing entertainment activities.
Relaxation Preferences: Emphasis on Maintaining Physical and Mental Health: This year, the most favored relaxation methods are hot springs/SPA/foot therapy (21%) and exercise (19%). Second are enjoying solitude time (such as reading, meditation, etc.), with an enthusiasm level of 14%. Additionally, 13% of high-net-worth respondents most favor watching movies.
When broken down by age groups:Among U25, the proportion who relax through exercise and ‘pet companionship and interaction’ is higher than in other age groups. Among U35, the proportion who relax through hot springs/SPA/foot therapy is higher than in other age groups. 53% of U45 often relax through ‘enjoying solitude time’ (such as reading, meditation, etc.). Among respondents over 45 years old, the proportion who relax through enjoying a cup of tea is higher than in other age groups.
Most Favored Cuisines: Cantonese Cuisine Preferred with Family, Japanese Cuisine Preferred with Friends: The dining preferences of high-net-worth individuals often vary depending on the dining scenario. When dining with family, the top three most favored cuisines among high-net-worth individuals are Cantonese cuisine (55%), Japanese cuisine (45%), and Sichuan cuisine (32%), and at such times, they place more emphasis on elegant and quiet ambiance and light, palate-friendly dishes. When dining with friends, the ranking of the top three most favored cuisines changes, with Japanese cuisine (49%), Cantonese cuisine (42%), and Sichuan cuisine (40%) ranking first, second, and third, and comparatively, more emphasis is placed on ritual and culinary experience.
Notably, the new options Bistro-style restaurants and Western-style brunch rank fifth and sixth in popularity when dining with friends. For high-net-worth individuals, when gathering with friends, a casual and enjoyable conversation atmosphere may be more important than simply ‘getting full’.
Most Favored Activities and Events: Concerts and Olympics. This year, the most favored activity among high-net-worth individuals is concerts (11%), with enthusiasm increasing by 3 percentage points compared to last year, and ranking rising by two places. Second are music festivals/small live performances (Livehouse)/concerts (10%), with enthusiasm increasing by 1 percentage point compared to last year. The Olympics rank third. Additionally, museum visits have an enthusiasm level of 7%, decreasing by 1 percentage point compared to last year; exhibitions also have an enthusiasm level of 7%, but increasing by 2 percentage points compared to last year.
When broken down by age groups: U25 most favors music festivals/small live performances (Livehouse)/concerts, and among U25, the proportion of NBA All-Star Game enthusiasts is the highest. U30 is the age group that most favors exhibitions. U40 shows higher enthusiasm for FIFA World Cup and UEFA Euro compared to other age groups. 42% of U45 most favor museum visits. 60% of respondents over 45 years old most favor the Olympics, with enthusiasm higher than in other age groups.
Work Hours and Vacations: Average 45 Hours Work per Week, 1.5 Days with Family, and 21 Days Annual Leave: The average weekly work hours is 45 hours, equivalent to 9 hours per workday, an increase of 1.4 hours compared to last year. Among them, U35 has the longest average working hours across all age groups. High-net-worth individuals spend an average of 6.3 days per month with their families, approximately 1.5 days per week. In this regard, U45 spends more time with family on average than other age groups. High-net-worth individuals have an average of 21 days of annual leave per year (including 13 statutory holidays), a decrease of 3 days compared to last year.
Domestic and International Travel Destinations: High-net-worth individuals have traveled abroad an average of 2.1 times in the past year. Sanya (46%) remains their most favored domestic travel destination, followed by Yunnan (44%) and Xinjiang (32%), with enthusiasm levels for Yunnan and Xinjiang increasing by 2 percentage points and 7 percentage points, respectively, compared to last year. 27% of respondents favor Hong Kong, China, placing it in fourth position. Macau (21%) and Tibet (21%) follow closely.
The Top 5 international travel destinations were led by Japan, Maldives, Switzerland, France, and New Zealand. From 2010 to 2026, enthusiasm for traveling to the United States has gradually declined, while interest in Switzerland and Maldives has slightly fluctuated upward. Additionally, Iceland has shown a significant rise in popularity, rising to sixth place.
Travel Themes: Sun and Beach Remain Top Choice, ‘Retail therapy Travel’ Declines: Among the most favored travel themes, sun and beach (17%) remains the top choice, with enthusiasm increasing by 5.5 percentage points compared to last year. Luxury resorts (14%) follow, rising by 3.4 percentage points. Historical landmarks (11%) rank third, slightly declining by 0.6 percentage points. Scenic lakes and mountains (11%) have increased by 1.7 percentage points. The shopping paradise theme has seen the largest decline, with enthusiasm at 3.8%, decreasing by 3.4 percentage points. The newly added travel theme "health and wellness retreats" has gained 3.1% enthusiasm. As high-net-worth individuals increasingly focus on refined health management, "health and wellness retreats" may become a popular travel theme.
Self-Education/Continuing Education: This year, the overall enthusiasm for "self-education/continuing education" among high-net-worth individuals has significantly decreased by 20 percentage points, with 75% of respondents considering self-education or continuing education. Among them, the most favored method is reading books/professional publications (20%), followed by online learning platforms (15%), and MBA/EMBA/DBA or similar courses (13%). Corporate study tours (12%) and workshops/training camps (3%) have declined significantly compared to last year, by 8 percentage points and 6 percentage points, respectively.
When broken down by age groups: U30 most favors corporate study tours. U35 primarily considers MBA/EMBA/DBA or similar courses. U40 mostly opts for online learning platforms. U45 and over 45 respondents mainly focus on reading books/professional publications.
Common Information Platforms and AI Assistants: 61% of high-net-worth individuals frequently use Little Red Book (Xiaohongshu) for information, 13 percentage points higher than TikTok (Douyin). 32% regularly watch WeChat Channels, and 24% frequently view Bilibili. East Money and Zhihu both exceed 20% enthusiasm, while Iwencai and Wind Information receive 14% enthusiasm.
By age groups: Over 70% of U25 use RED (Xiaohongshu) and TikTok (Douyin) as their primary information platforms. U40 and over 45 high-net-worth individuals prefer WeChat Channels. Professional investment software such as East Money, Wind Information, and Iwencai are primarily used by U35 and U40.
The top three financial influencers most followed by high-net-worth individuals are Wu Xiaobo Channel (38%), Qin Shuo (23%), and Ren Zeping (17%). In this survey, Hurun did not include our own media platforms.
High-net-worth individuals most commonly use DeepSeek and Bean Bag (DouBao) as their AI assistants. By age groups: U25 most frequently use ChatGPT. U30, U35, U40, and U45 primarily use DeepSeek. Over 45 respondents most commonly use Bean Bag (DouBao).
Children's Overseas Education: Enthusiasm Declines, United States Remains Top Choice: 55% have plans to send their children overseas for education, with most planning for the university stage, and an average planned age of 16 years, consistent with last year. Ultra-high-net-worth individuals tend to plan earlier, with an average planned age of 14 years.
The United States has remained the most favored destination for children's overseas education for three consecutive years, with enthusiasm slightly declining by 2 percentage points compared to last year. The United Kingdom ranks second, with enthusiasm decreasing by 13 percentage points. Singapore maintains 26% enthusiasm, unchanged from last year. Australia's enthusiasm remains relatively stable. Hong Kong, China's enthusiasm has increased by 4 percentage points.
Notable declines are observed in other European countries (Germany, France, Switzerland) and Canada. Among these, Canada has experienced the largest decline, dropping from 31% to 11%.
International Identity Planning: Overall Willingness Declines, Singapore and Canada Cool Down, United States Rises: 66% are not considering a permanent residency abroad or a new passport, increasing by 10 percentage points compared to last year. The proportion of those who have already relocated has risen from 2% to 5%, while the proportion in the application process remains unchanged from last year.
Over the 15-year period from 2012 to 2026, the willingness of high-net-worth individuals to plan for international identity has gradually decreased. The overall willingness of respondents peaked relatively in 2024 and 2025, but has significantly declined this year; the willingness of ultra-high-net-worth individuals has been in a trough for three consecutive years.
This year, the United States ranks first as the preferred international identity planning destination for high-net-worth individuals; followed by EU countries (Germany, France, Italy, Greece, etc.), with enthusiasm increasing by 8 percentage points compared to last year; Hong Kong, China ranks third, with enthusiasm also increasing by 8 percentage points compared to last year. The enthusiasm for Singapore and Canada has significantly declined, decreasing by 10 percentage points and 8 percentage points, respectively.
Investment Directions for the Next Year: Increase Holdings in Gold, Overseas Investments, Funds, and Insurance; Decrease Holdings in Real Estate: In terms of net growth/reduction intentions (i.e., the difference between the proportion of those increasing and those decreasing), the net growth intention for gold investments in the next year reaches 15%, indicating a clear willingness to increase holdings. The net growth intention for overseas investments is 7%, while for funds and insurance investments, it is 6% each, showing a general inclination towards increasing holdings.
The net reduction intention for real estate investments is 21%, and for art and collectibles investments, it is 10%, reflecting a clear willingness to decrease spending. The net reduction intention for A-shares is 3%, while the net growth intention for bank deposits (and wealth management products) is 1%, indicating a divergence in intentions.
From 2020 to the present, the investment preferences have undergone significant changes. The net growth intention for gold investments has fluctuated upwards, reaching a new high this year. The net growth intention for real estate investments has fluctuated downwards, reaching its lowest point in 2024. The net reduction intention for art and collectibles investments is 9.8%, with the reduction intention at its highest level in the past seven years.
84% of High-Net-Worth Individuals Consider Overseas Investments, Preferring to Increase Holdings in US and HK Stocks: 84% consider overseas investments, with U35 showing the highest enthusiasm and over 45 respondents showing the lowest. In terms of net growth/reduction intentions (i.e., the difference between the proportion of those increasing and those decreasing), the net growth intention for US stock investments is 17%, and for HK stock investments is 10%, indicating a clear willingness to increase holdings.
The net growth intention for stablecoins and gold is 4% each, showing a slight inclination towards increasing holdings. The net reduction intention for real estate investments is 6%, reflecting a clear willingness to decrease holdings. For investment categories such as cryptocurrencies, insurance, bank deposits and wealth management products, and RWA (Real World Assets, such as tokenized government bonds), there is a divergence in intentions.
Overseas Investment Locations: Hong Kong, China Remains Top Choice, Singapore-Malaysia-Thailand and EU Countries Cool Down: This year, the most favored overseas investment location for high-net-worth individuals remains Hong Kong, China (43%), with enthusiasm slightly increasing by 2 percentage points compared to last year. United States (26%) follows, with enthusiasm increasing by 2 percentage points, and its ranking also improving by two positions.
Investment enthusiasm for Singapore-Malaysia-Thailand and EU countries has clearly declined. Among them, Singapore-Malaysia-Thailand has dropped one position, while EU countries have dropped two positions, with both experiencing a decline of 14 percentage points.
Overseas Asset Proportion: Average of 15%, Slightly Down from Last Year: The average proportion of overseas assets in the investable assets of high-net-worth individuals is 15%, 1.1 percentage points lower than last year. Respondents from Tier-1 cities have a slightly higher overseas asset proportion (16%) compared to those from new Tier-1 cities (15%).
The overseas asset proportion for ultra-high-net-worth individuals is 26%, and for respondents with investable assets exceeding CNY50mn(US $ 7.1mn), the overseas asset proportion reaches 30%.
Domestic and Overseas Business Trips: Average of 2.9 Overseas Trips in 2025, Hong Kong, China is Key Overseas Destination: This year, the surveyed high-net-worth individuals average 6.9 days of business trips per month, 0.3 days fewer than last year, with 39% of respondents traveling less than 5 days per month. 62% of high-net-worth individuals had overseas business trips in 2025, with an average of 2.9 trips.
The top three key overseas destinations for high-net-worth individuals' business trips are Hong Kong, China (45%), Singapore-Malaysia-Thailand (31%), and United States (30%). EU countries (25%) rank fourth, followed by the Middle East (21%).
Most Favored Overseas Cities: Hong Kong, China Tops the List: 36% of surveyed high-net-worth individuals favor Hong Kong, China as their most preferred overseas city. Singapore (26%) ranks second, followed by New York, United States (24%).
By age groups: U25 most favors Hong Kong, China and Dubai; U30 most favors Tokyo; U35 most favors Singapore, followed by Hong Kong, China; U40 shows greater enthusiasm for Singapore compared to other age groups.
Future-Year Collection Directions: Increase Holdings in Gold and Its Crafts, Decrease Holdings in Luxury Watches and Fine Wines: In terms of net growth/reduction intentions (i.e., the difference between the proportion of those increasing and those decreasing), the net growth intention for gold and its crafts collection is 24%, for jewelry and jade collection is 10%, for Chinese painting and calligraphy collection is 7%, and for premium tea collection is 3%. The net reduction intention for Western paintings and sculptures and classical furniture is 3% each, indicating a tendency to decrease holdings. For collection categories such as luxury watches, fine wines, and porcelain and other curios, there is a divergence in intentions.
Charitable Contributions and Support for Relatives: Tendency to Use Internet Public Welfare Platforms for Charity, Tendency to Use Networking for Supporting Relatives: This year, the most favored charitable channel is donating through Internet public welfare platforms, though enthusiasm has slightly decreased by 1 percentage point compared to last year. Donating to charitable institutions follows, with enthusiasm declining by 6 percentage points. Additionally, 10% of respondents prefer charitable trusts, with enthusiasm also decreasing by 6 percentage points.
The average donation target amount for high-net-worth individuals in the next year is US$20,000 significantly lower than last year by US$33,000.
23% of high-net-worth individuals primarily support relatives through networking referrals, followed by emergency assistance (21%), and then job opportunities (20%). The proportions for providing emergency assistance and job opportunities have both decreased by 9 percentage points, ranking third and fourth, respectively. The proportion for supporting children's education has decreased by 8 percentage points, ranking fifth.
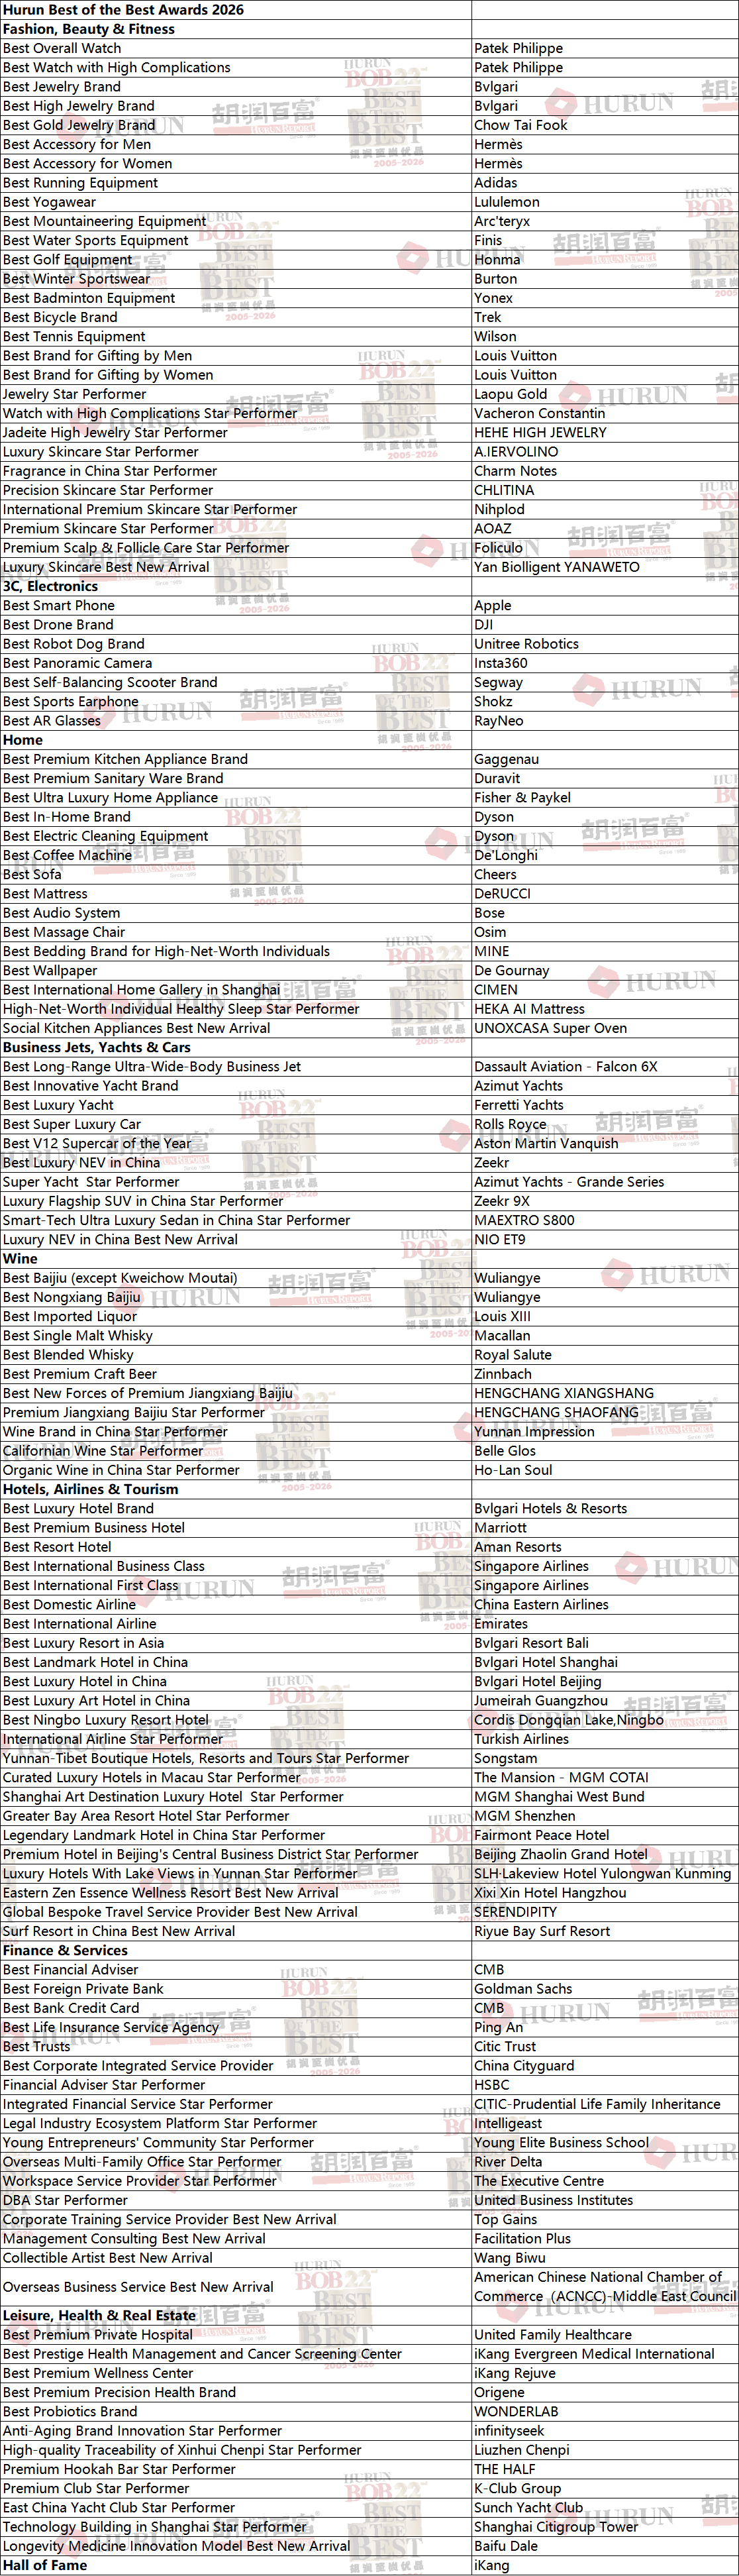
Awards
The Hurun Research Institute today released the Hurun Best of the Best Awards 2026, based on the results of the Hurun Chinese Luxury Consumer Survey 2026.
The Best of the Best is for the overall winner of a category. The Star Performer is for the product/service with the best year on year performance. The Best New Arrival is for a product/service launched into China in the past 12 months that has shaken up the market.
About Hurun Inc.
Promoting Entrepreneurship Through Lists and Research
Oxford, Shanghai, Mumbai
Established in the United Kingdom in 1999, Hurun is a research and media group, promoting entrepreneurship through its lists and research. Widely regarded as an opinion-leader in the world of business, Hurun generated 8 billion views on the Hurun brand in 2024, mainly in China and India, and recently expanding to the UK, US, Canada and Australia.
Best-known for the Hurun Rich List series, telling the stories of the world’s successful entrepreneurs in China, India and the world, Hurun’s other key series focus on young businesses and entrepreneurs, through the Hurun Unicorns Index, two Hurun Future Unicorns indices, the Hurun Uth series and the Hurun Pioneers series.
Hurun has grown to become the world’s largest list compiler for start-ups, ranking over 3000 start-ups across the world through its annual Hurun Global Unicorns Index (startups with a valuation of US$1bn+), and two Hurun Future Unicorn Indexes: Gazelles, most likely to ‘go unicorn’ within three years, and Cheetahs, most likely to ‘go unicorn’ within five years.
The Hurun Pioneering Young Startups and Entrepreneurs series focuses on startups set up within the last ten years and founders aged 45 or under.
The Hurun Uth series includes the Under25s, Under30s, Under35s and Under40s awards, representing the cream of each generation of young entrepreneurs who have founded businesses with a social impact and worth US$1m, US$10m, US$50m and US$100m respectively.
Other lists include the Hurun 500 series, ranking the most valuable companies in the world, China and India, the Hurun Global High Schools List, ranking the world’s best independent high schools, the Hurun Philanthropy List, ranking the biggest philanthropists and the Hurun Art List, ranking the world’s most successful artists alive today.
Hurun provides research reports co-branded with some of the world’s leading financial institutions and regional governments.
Hurun hosts high-profile events across China and India, as well as London, Paris, New York, LA, Toronto, Vancouver, Sydney, Luxembourg, Istanbul, Dubai and Singapore.
For further information, see www.hurun.net.
For media inquiries, please contact:
Hurun Report
Porsha Pan
Email: porsha.pan@hurun.net